Cytokine analysis - intracellular cytokine staining by flow cytometry
Intracellular cytokine staining (ICS) is a method of cytokine analysis that provides information on the type of cytokines that are produced upon (antigen-specific) stimulation of T cells and B cells.
For instance, ICS can reveal which subtype of CD4+ T helper cell is induced under certain culture conditions, and indicates whether a biological or compound alters T cell polarization in vitro. Rather than looking at the total amount of secreted cytokines produced by all the cells in culture, which is generally analyzed by ELISA or CBA, ICS will give you information on cytokine production by each individual cell. This allows you to analyze the proportion of cells that produce a cytokine of interest, or allows for quantification of the amount of cells producing multiple cytokines (i.e. the rate of polyfunctionality).
This can help, for example, to unravel the polarization, strength and specificity of immune responses upon immune-modulating therapies.
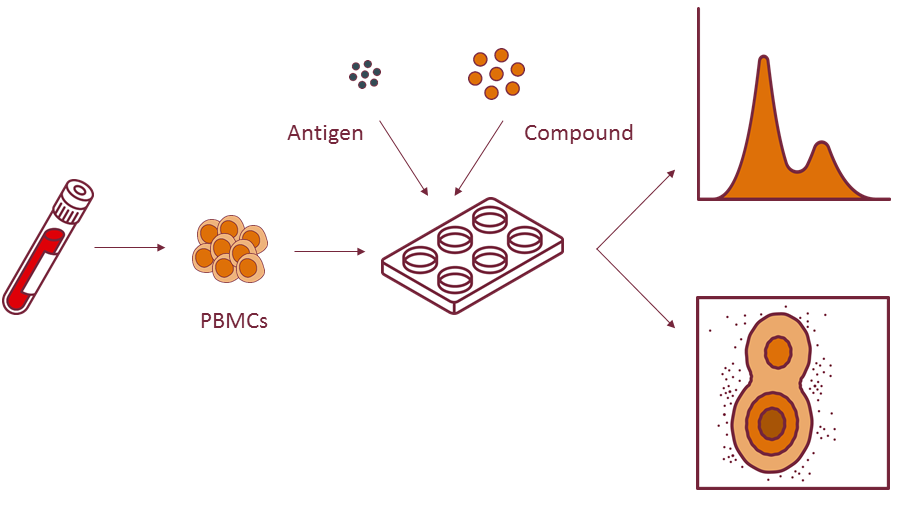 Total PBMCs or cell subsets are isolated from blood and cultured in the presence of your stimulation of interest (e.g. pathogen-specific antigen) with or without the presence of an (immunomodulatory) compound. Cytokine production can then be assessed via flow cytometry.
This flow cytometric approach is especially suited to combine with the following assays:
- CD40L upregulation assay
- Proliferation assay
- Transcription factor expression analysis
Example of detecting cytotokine production via flow cytometry
Anti-TNF-α polarizes T cells towards IL-10 and away from IFN-γ
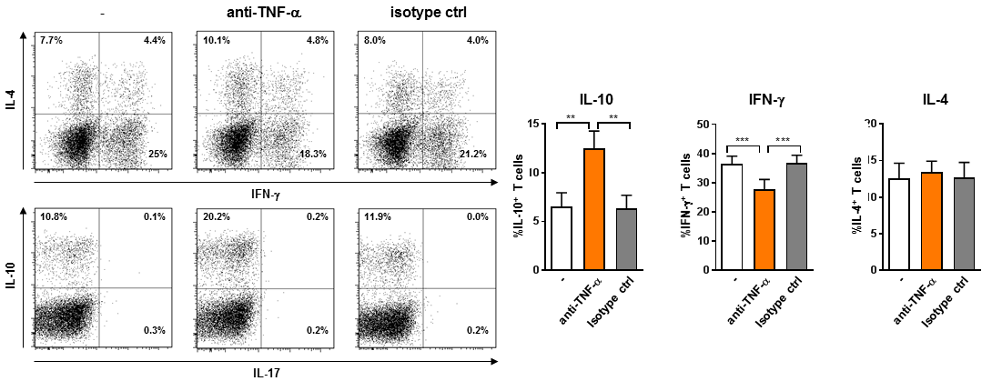
Naïve CD4+ T cells were primed by tolerogenic DCs for 2 weeks in the presence of anti-TNFa or an isotype control. T cells were subsequently re-stimulated with PMA and ionomycin and stained intracellularly for IL-4, IL-10, IFN-γ and IL-17 (compilation data not shown). A representative dotplot (left) and combined results of 14 independent experiments (right) are shown. Percentage of IL-4, IL-10, and IFN- g producing T cells determined by intracellular staining of re-stimulated primed T cells.
Mean + standard error of mean of n=14. *p≤0.05, **p≤0.01, ***p≤0.001.
For more examples, see the references below.
References
GPA33: A Marker to Identify Stable Human Regulatory T Cells
Opstelten R, de Kivit S, Slot MC, van den Biggelaar M, Iwaszkiewicz-Grześ D, Gliwiński M, Scott AM, Blom B, Trzonkowski P, Borst J, Cuadrado E, Amsen D.
J Immunol 2020;204(12):3139-48. doi: 10.4049/jimmunol.1901250.
Human T cells employ conserved AU‐rich elements to fine‐tune IFN‐g production
Freen-van Heeren JJ, Popović B, Guislain A, Wolkers MC.
Eur J Immunol 2020;50(7):949-58. doi: 10.1002/eji.201948458.
Inhibition of TNF receptor signaling by anti-TNFa biologicals primes naïve CD4+ T cells towards IL-10+ T cells with a regulatory phenotype and function
Boks MA, Kager-Groenland JR, Mousset CM, van Ham SM, ten Brinke A.
Clin Immunol 2014;151(2):136-45. doi: 10.1016/j.clim.2014.02.008.
Assay options
We offer cytokine analysis via flow cytometry in combination with several different standardized stimulation assays, but feel free to contact us for an assay customized to your needs.
Combine cytokine analysis via flow cytometry with other assays
This flow cytometric approach is especially suited to combine with the following assays:
Other cytokine analyses
We also offer other methods of cytokine analysis.